are typical for immature products with design flaws.
should customers encounter with their product.
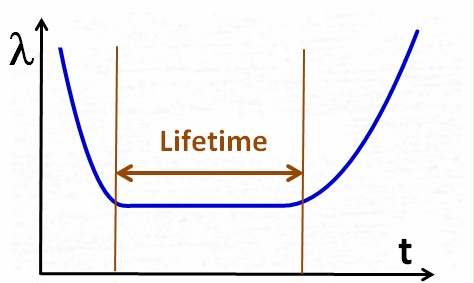
The Bathtub Curve
In
reliability context, the so called bathtub curve is an idealized
representation of the failure rate (or MTBF) of a population of items
over time.
The
bathtub curve has three phases, each of them representing a product
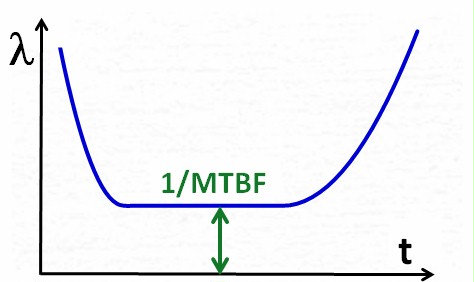
life phase. Lambda = failure rate = 1/MTBF, and t = time.
|
|
|
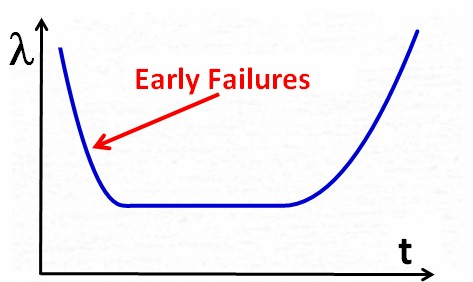
| Early
failures, also called infant mortality, are typical for immature products with design flaws. |
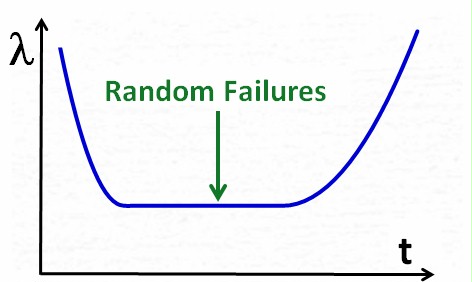
The useful
product life phase. This and only this life phase should customers encounter with their product. |
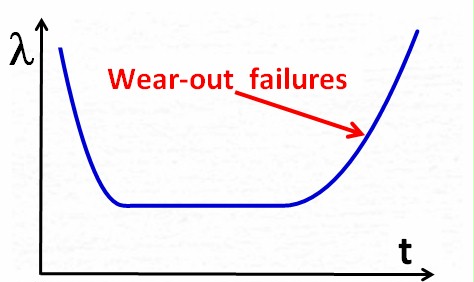
Old products
beyond their useful lifetime. |
As said, this curve is idealized. Most real curves are not that smart.
Apart from the 3 product life phases, the bathtub curve shows
an even more important topic: Lifetime and MTBF are *obviously* not the same.
While
Lifetime is just the duration of the product life (the t-axis), MTBF
(or it's reciprocal lambda, failure rate) is a function of t.
 |
 |
The difference boils down to this:
The MTBF is the mean
time between two failures during the
useful product life phase.
MTBF
depends strongly on the complexity (= # of single components) of the
system, whereas Lifetime is always in the same range regardless of the
type of product, typically between 10 and 30 years. The table below
gives some examples.
| System |
Relationship
MTBF vs Lifetime |
| Hard disk
drive |
MTBF
(1 mio h) >> Lifetime (15 y) |
| Automobile |
MTBF (15 y) ~
Lifetime (15 y) |
| Wide body
aircraft |
MTBF
(several weeks) << Lifetime (20 y) |
The
bathtub curve is actually a sum of three individual curves
All
three individual curves can be expressed by the Weibull distribution,
however with different form factors:
| Life
phase |
Weibull
distribution form factor |
| Early
failures |
Form factor
< 1 |
| Random
failures |
Form factor
= 1, exponential distribution |
| Wear-out
failures |
Form factor > 1 |
Privacy Policy